Guide: UI Overview (User-Focused)
This page explains what you see in the app and what each area means for day-to-day protection.
If this is your first session, start with:
Quick Visual Map
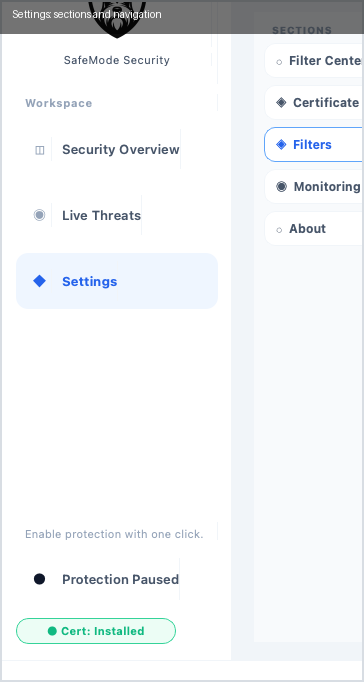
1) Security Overview
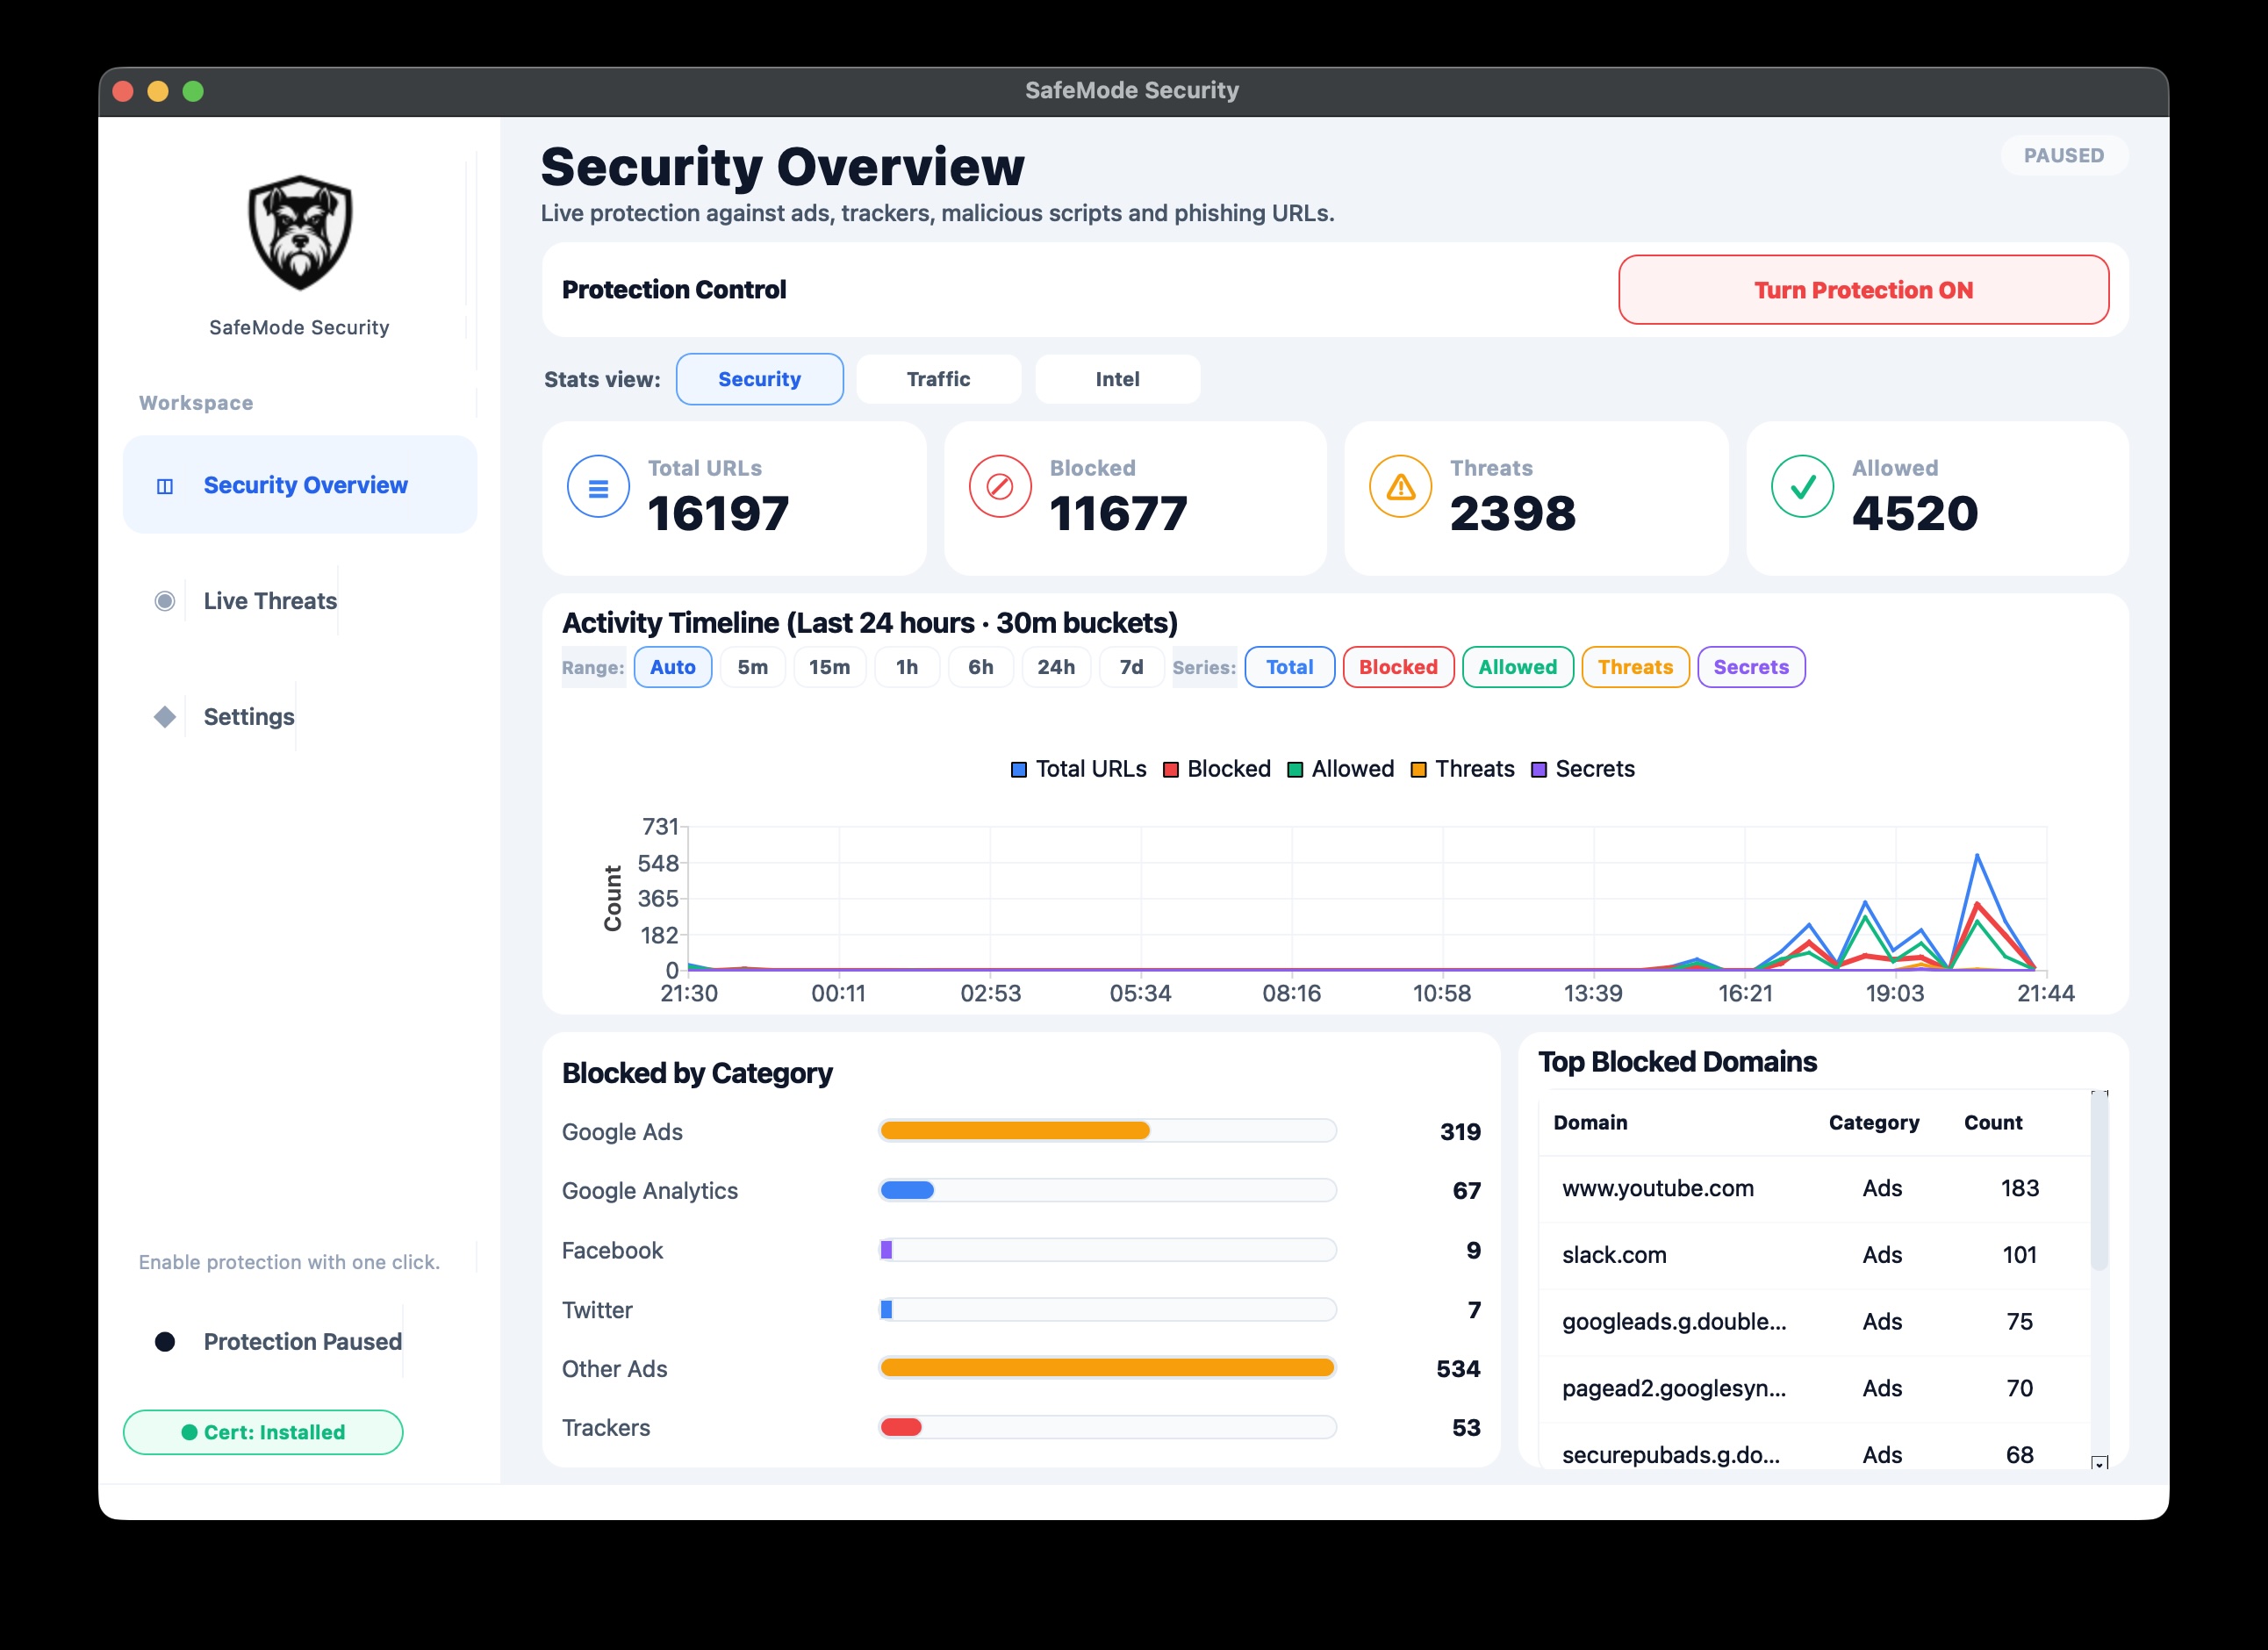
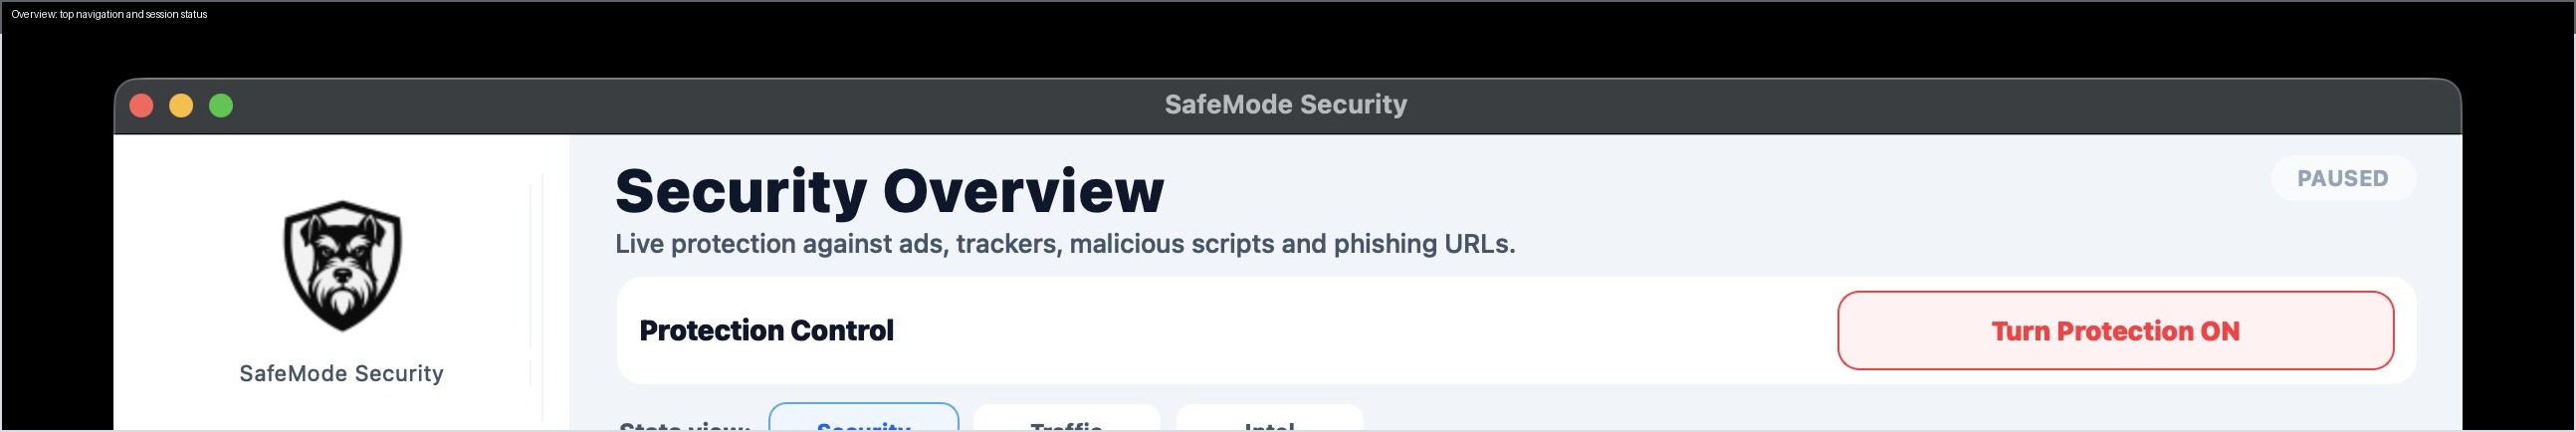
Use this screen to answer one question quickly: am I protected and is traffic being inspected right now?
What to watch first:
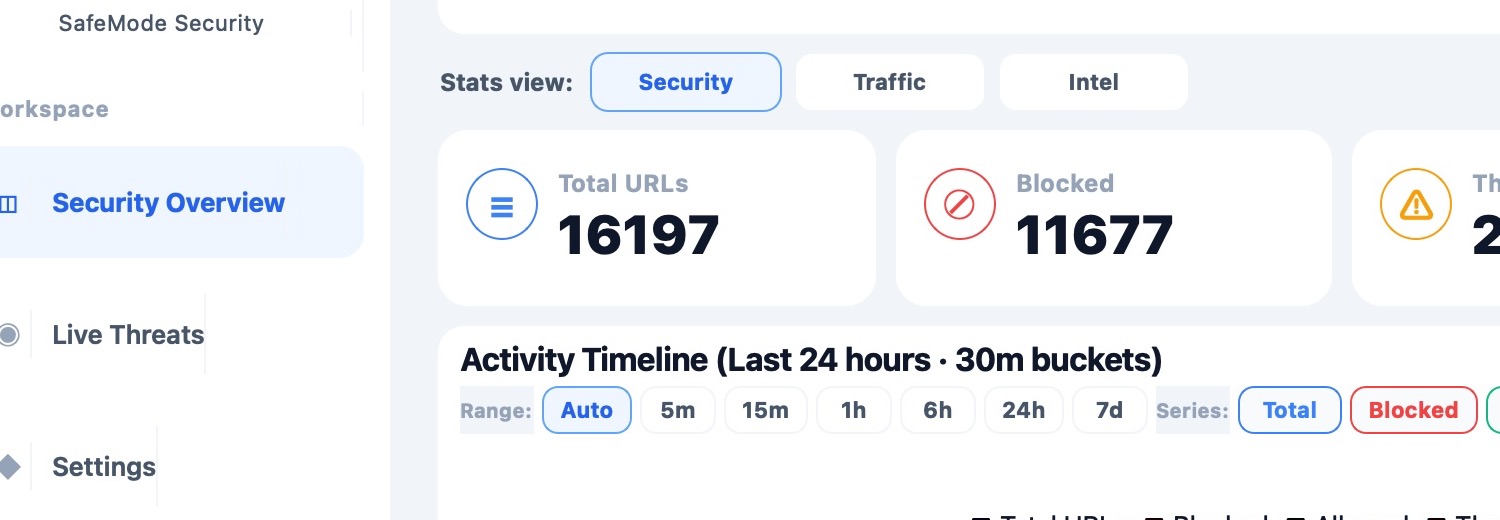
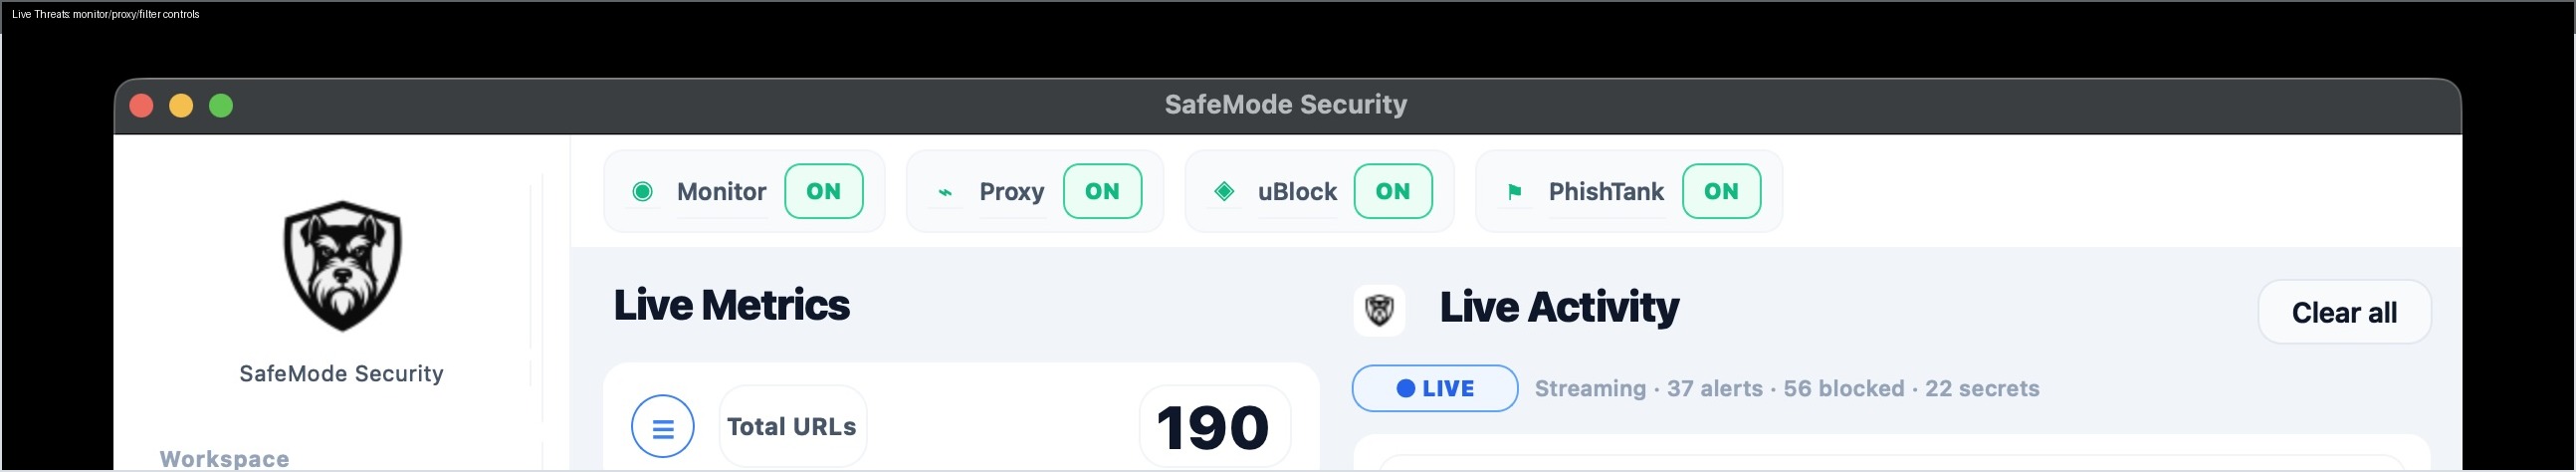
- Monitor and proxy status are active.
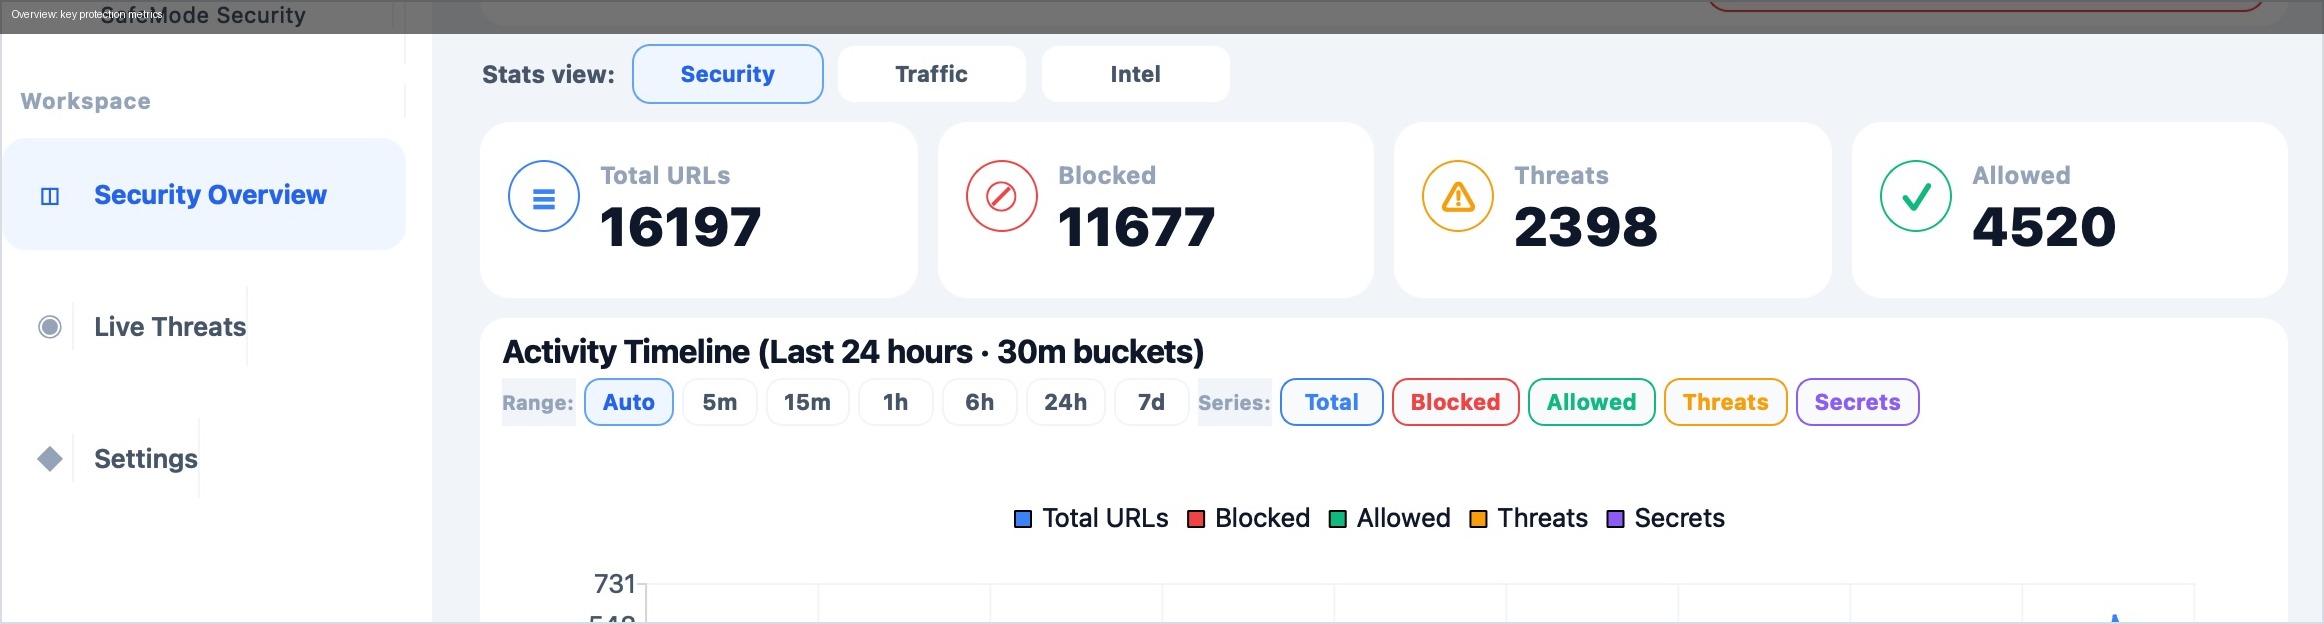
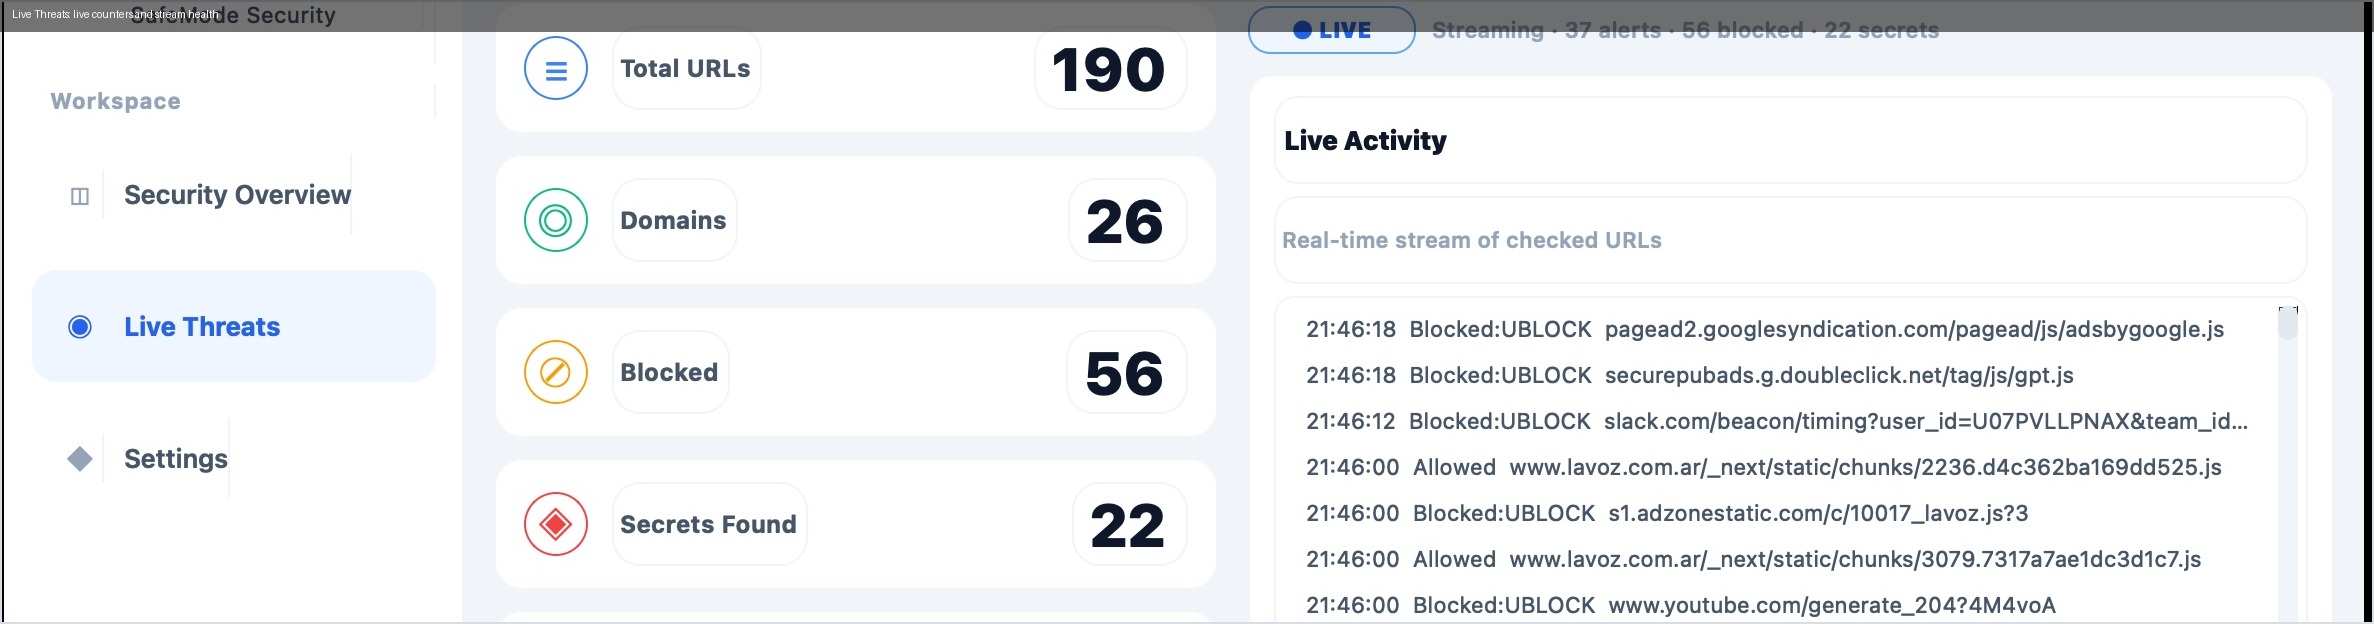
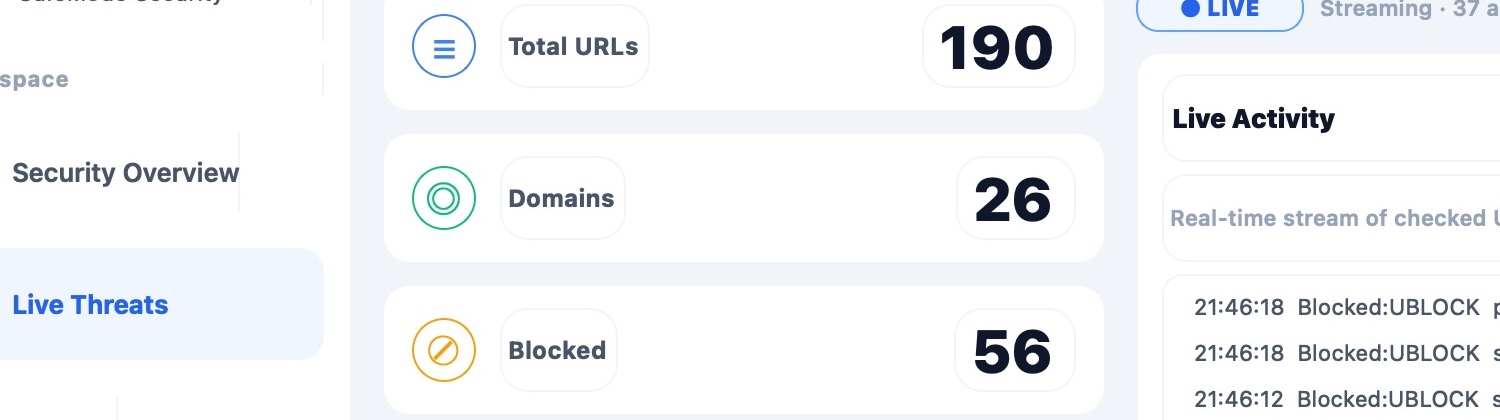
- Total inspected requests keeps increasing.
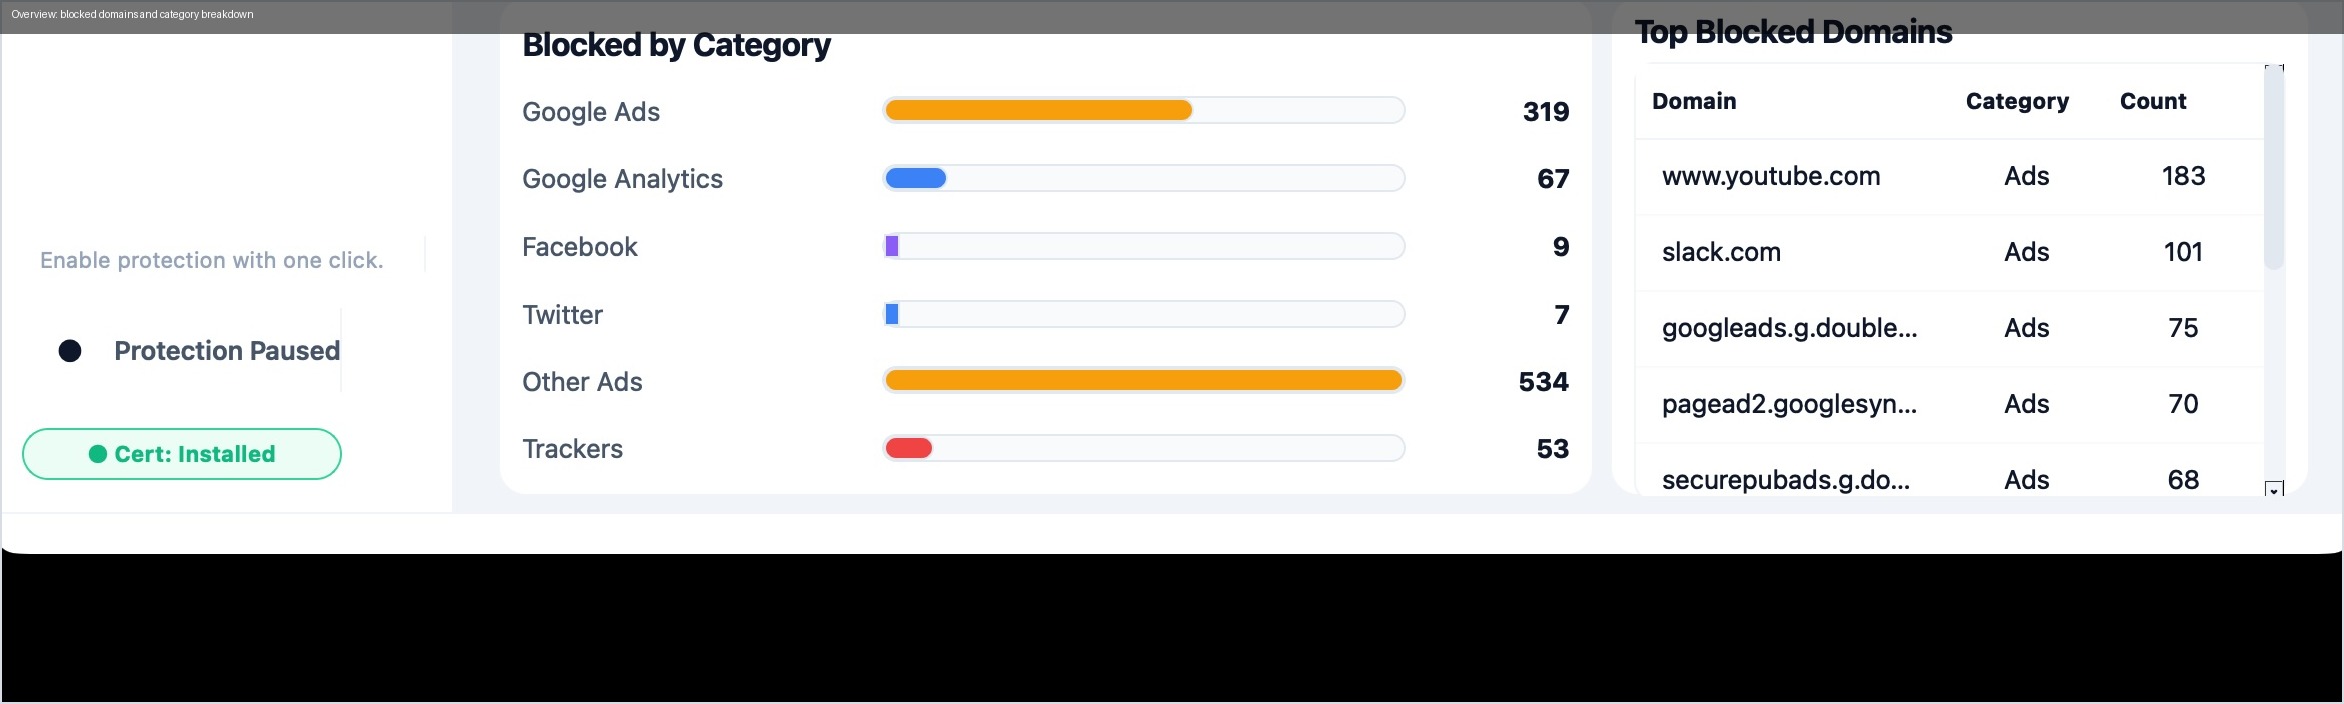
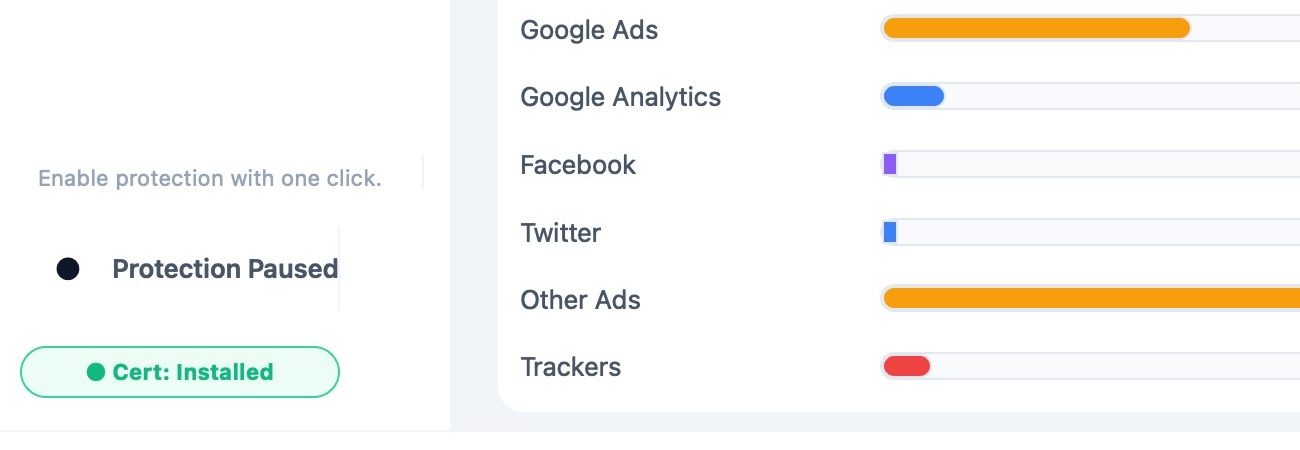
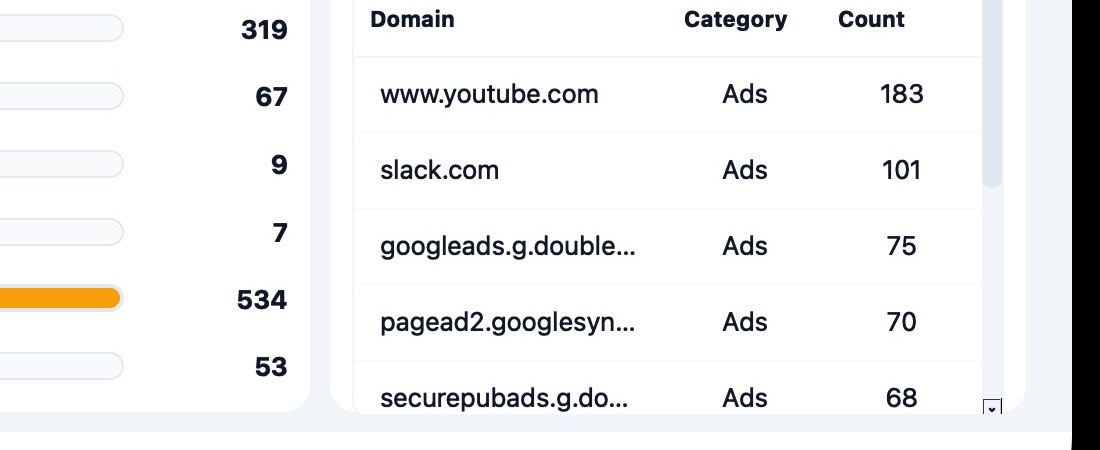
- Blocked requests are visible (ads, trackers, malicious pages).
- Threat counters (phishing / secrets / suspicious patterns) are non-zero only when needed.
Detailed captures:
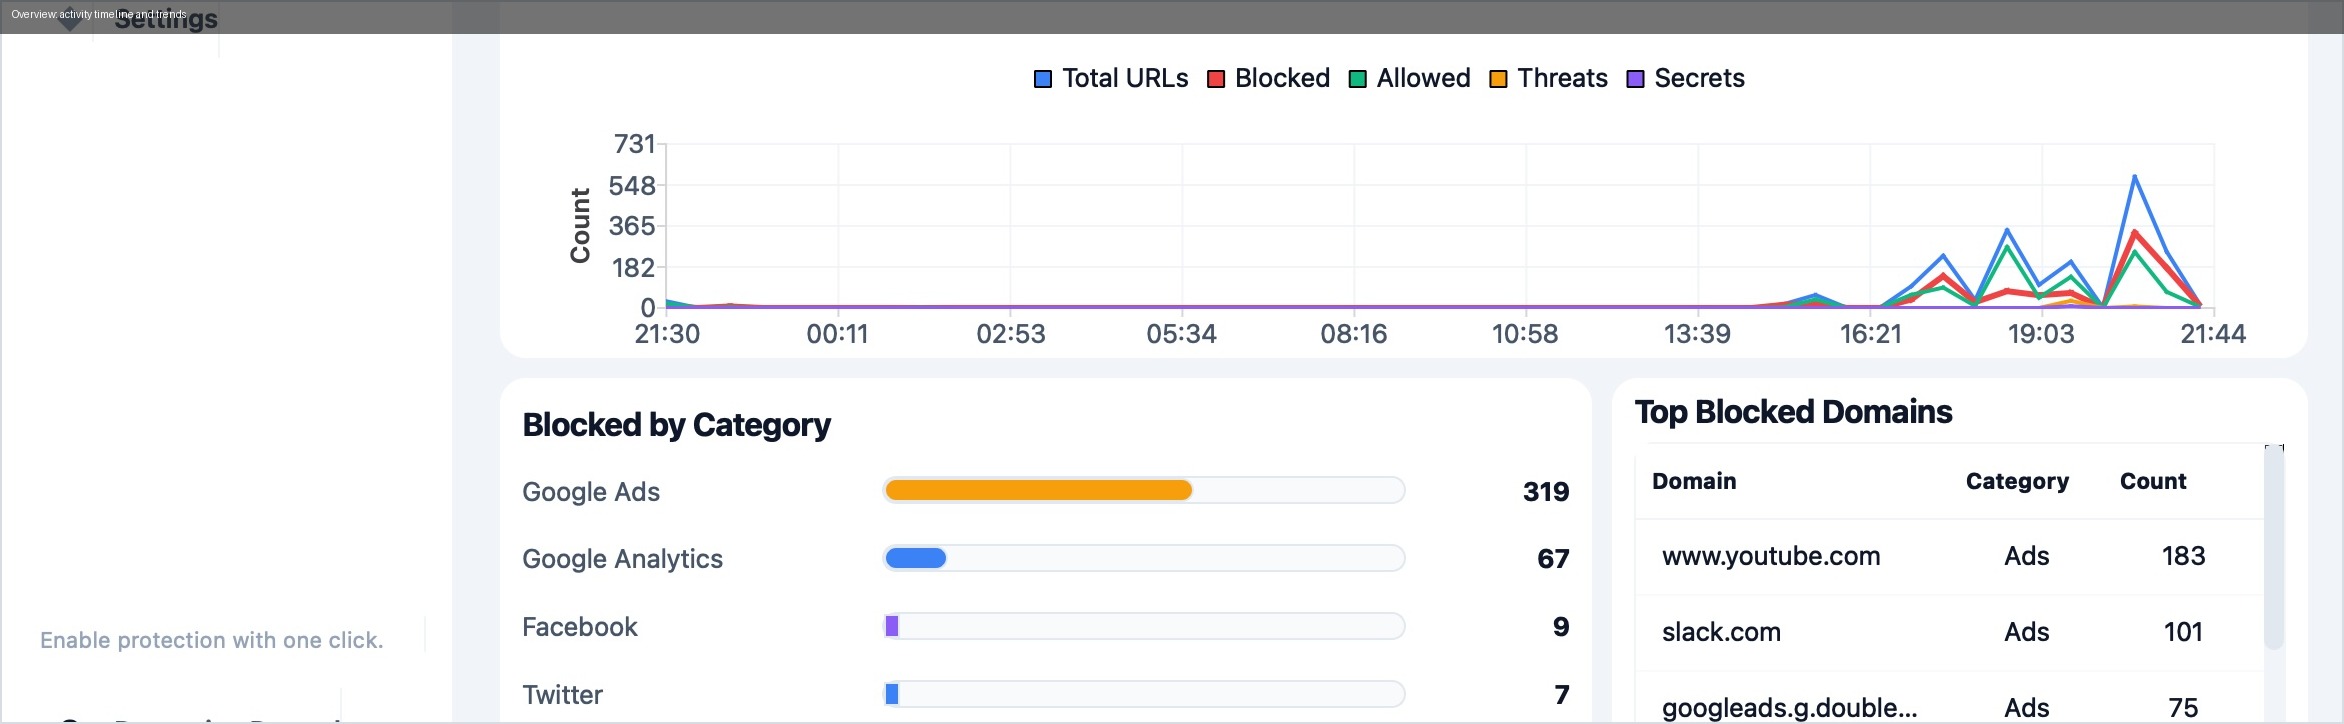
How to interpret it:
- A high blocked count with low threat count is usually healthy filtering.
- A sudden jump in threat count should be reviewed in Live Threats.
- If counts freeze while browsing, monitor or proxy may be off.
2) Live Threats
Use this screen for active monitoring and incident triage.
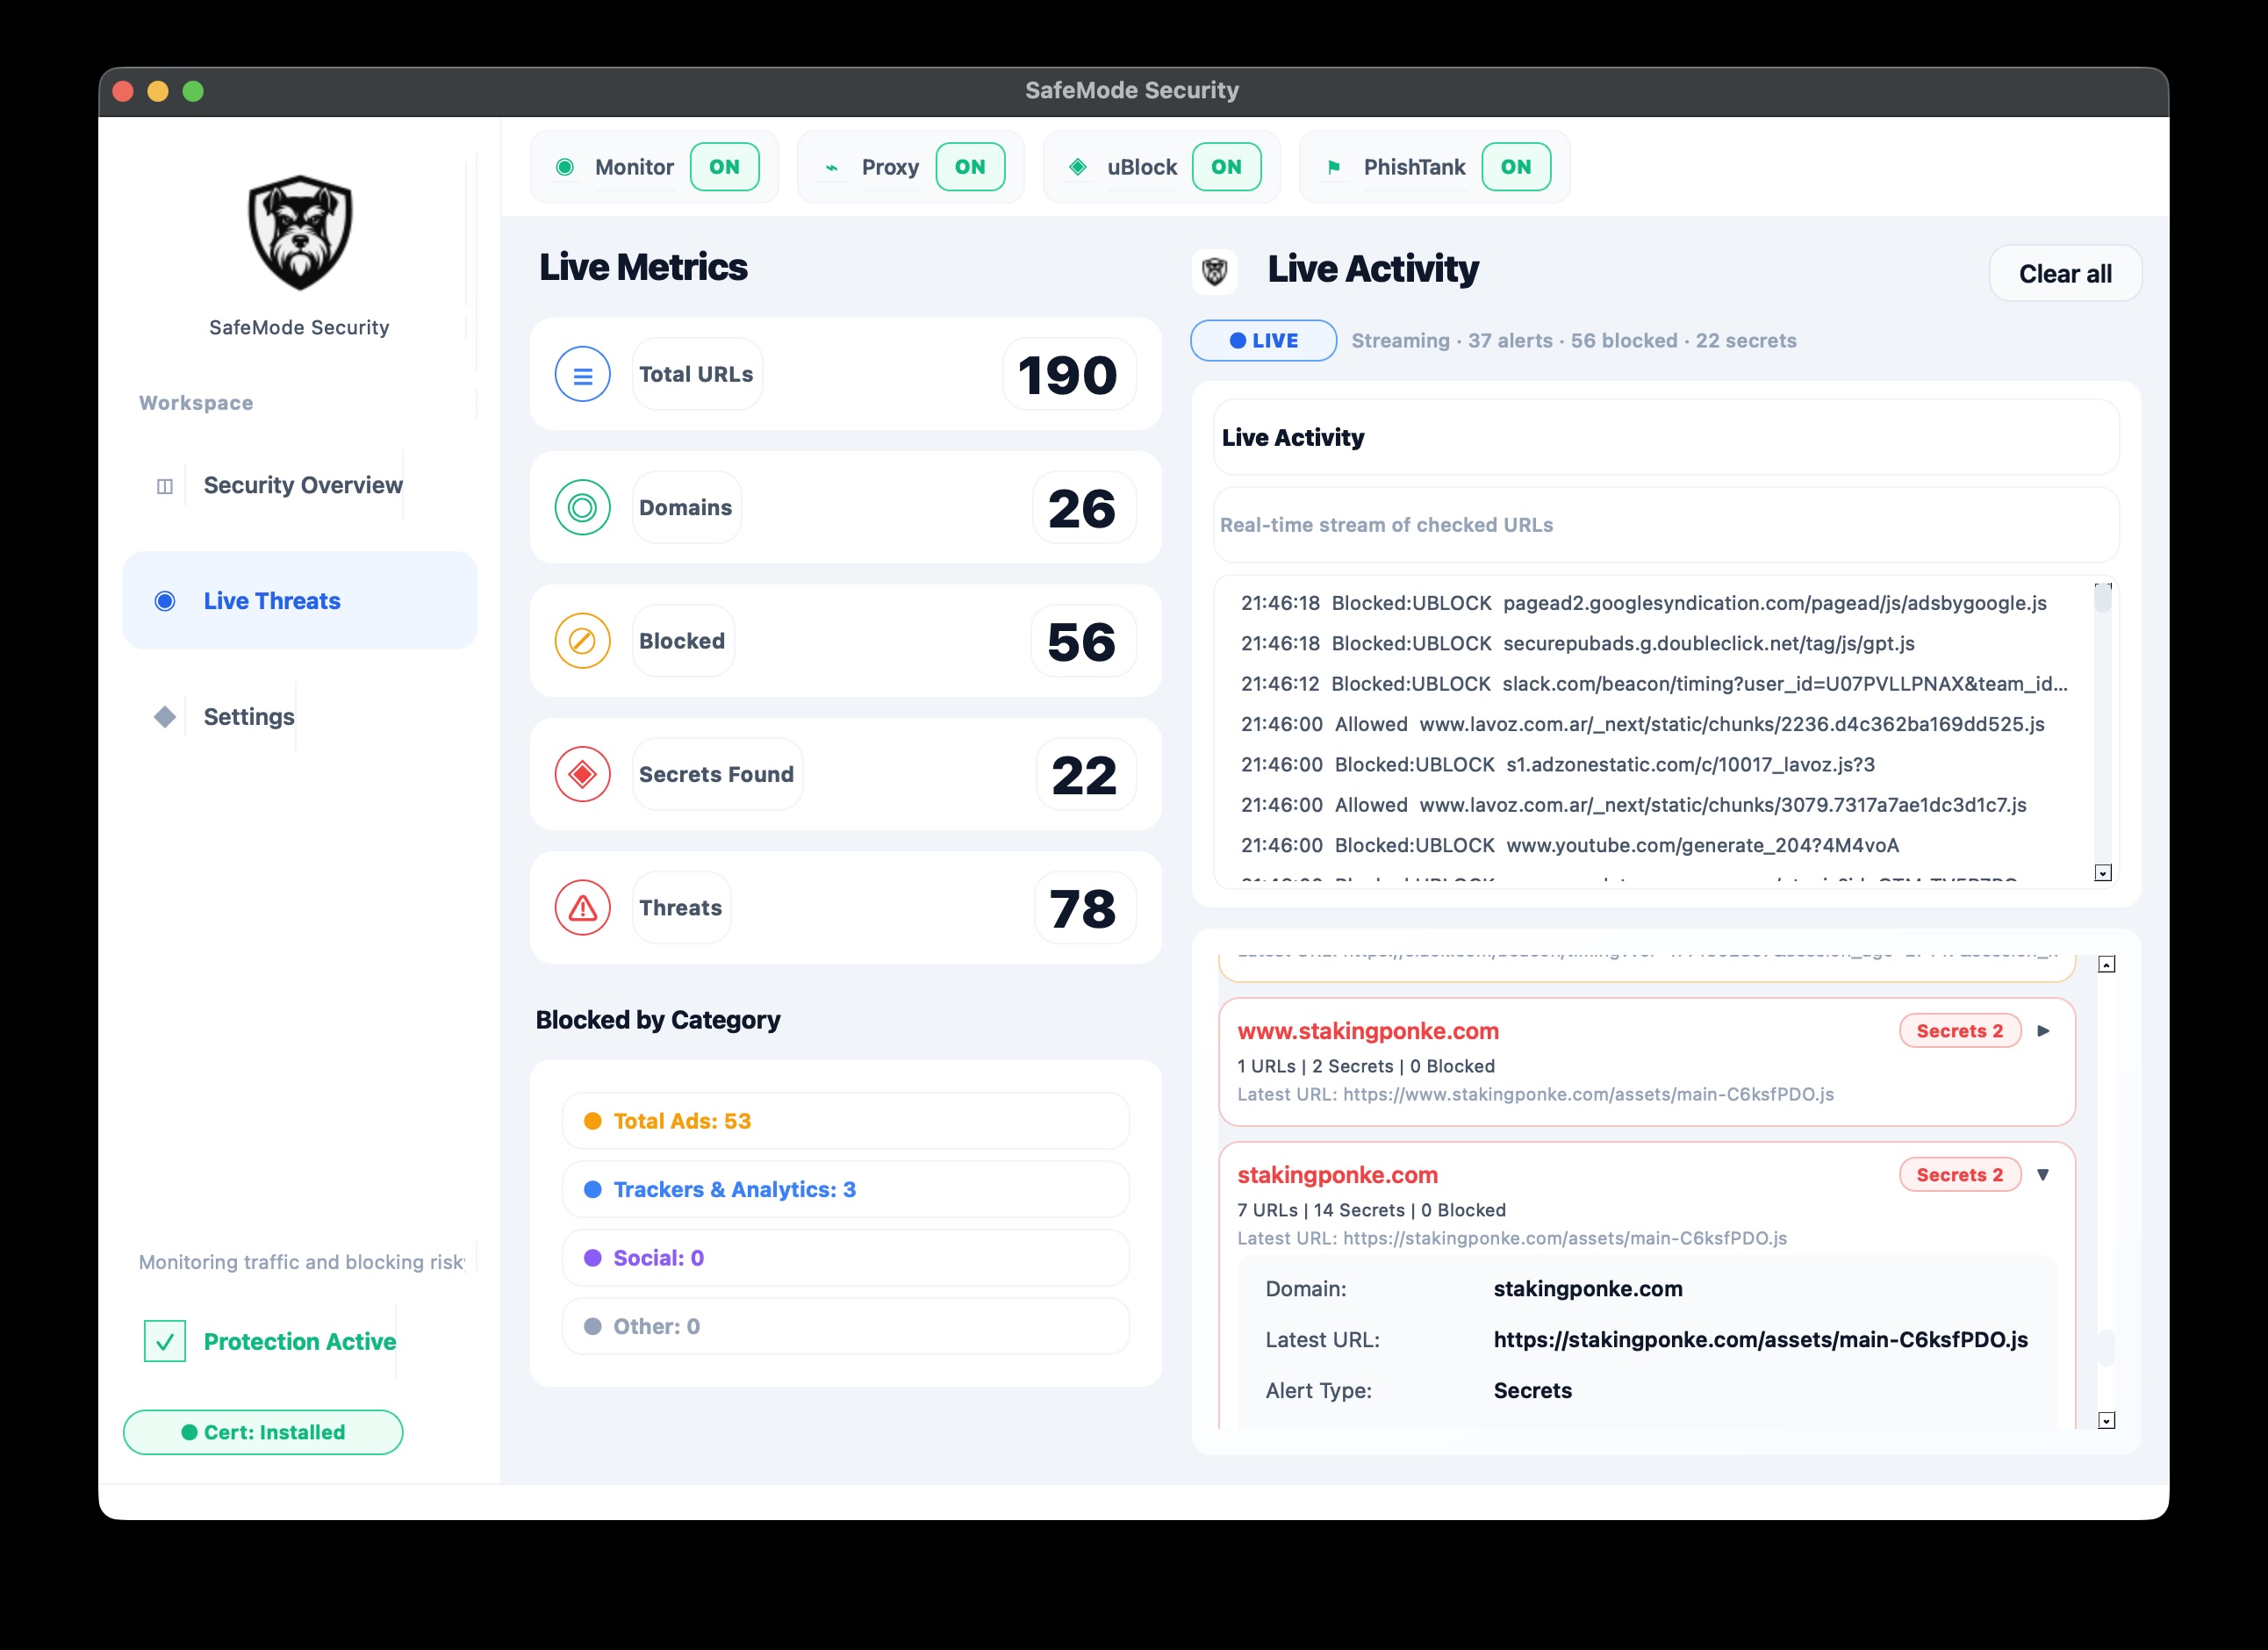
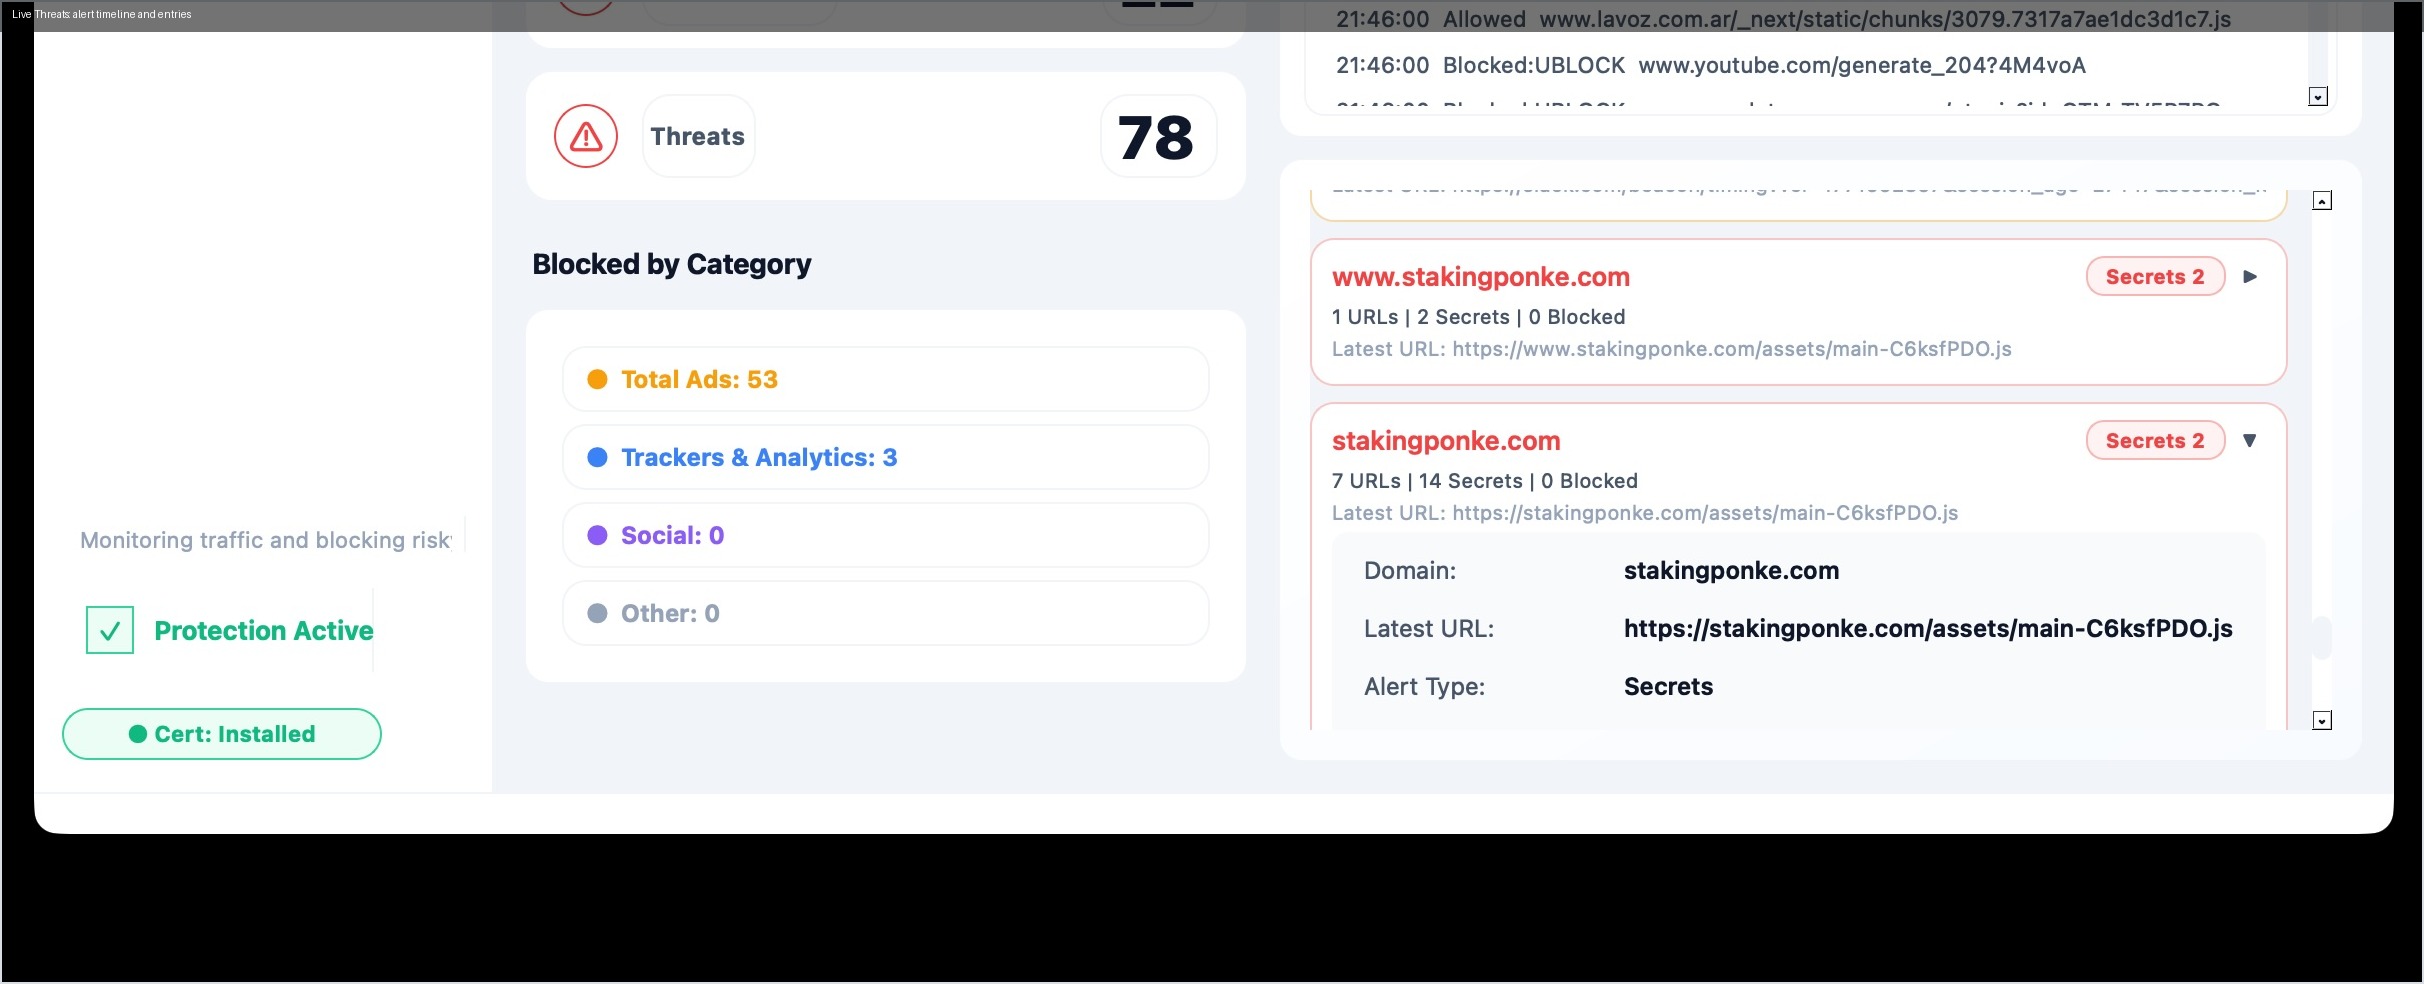
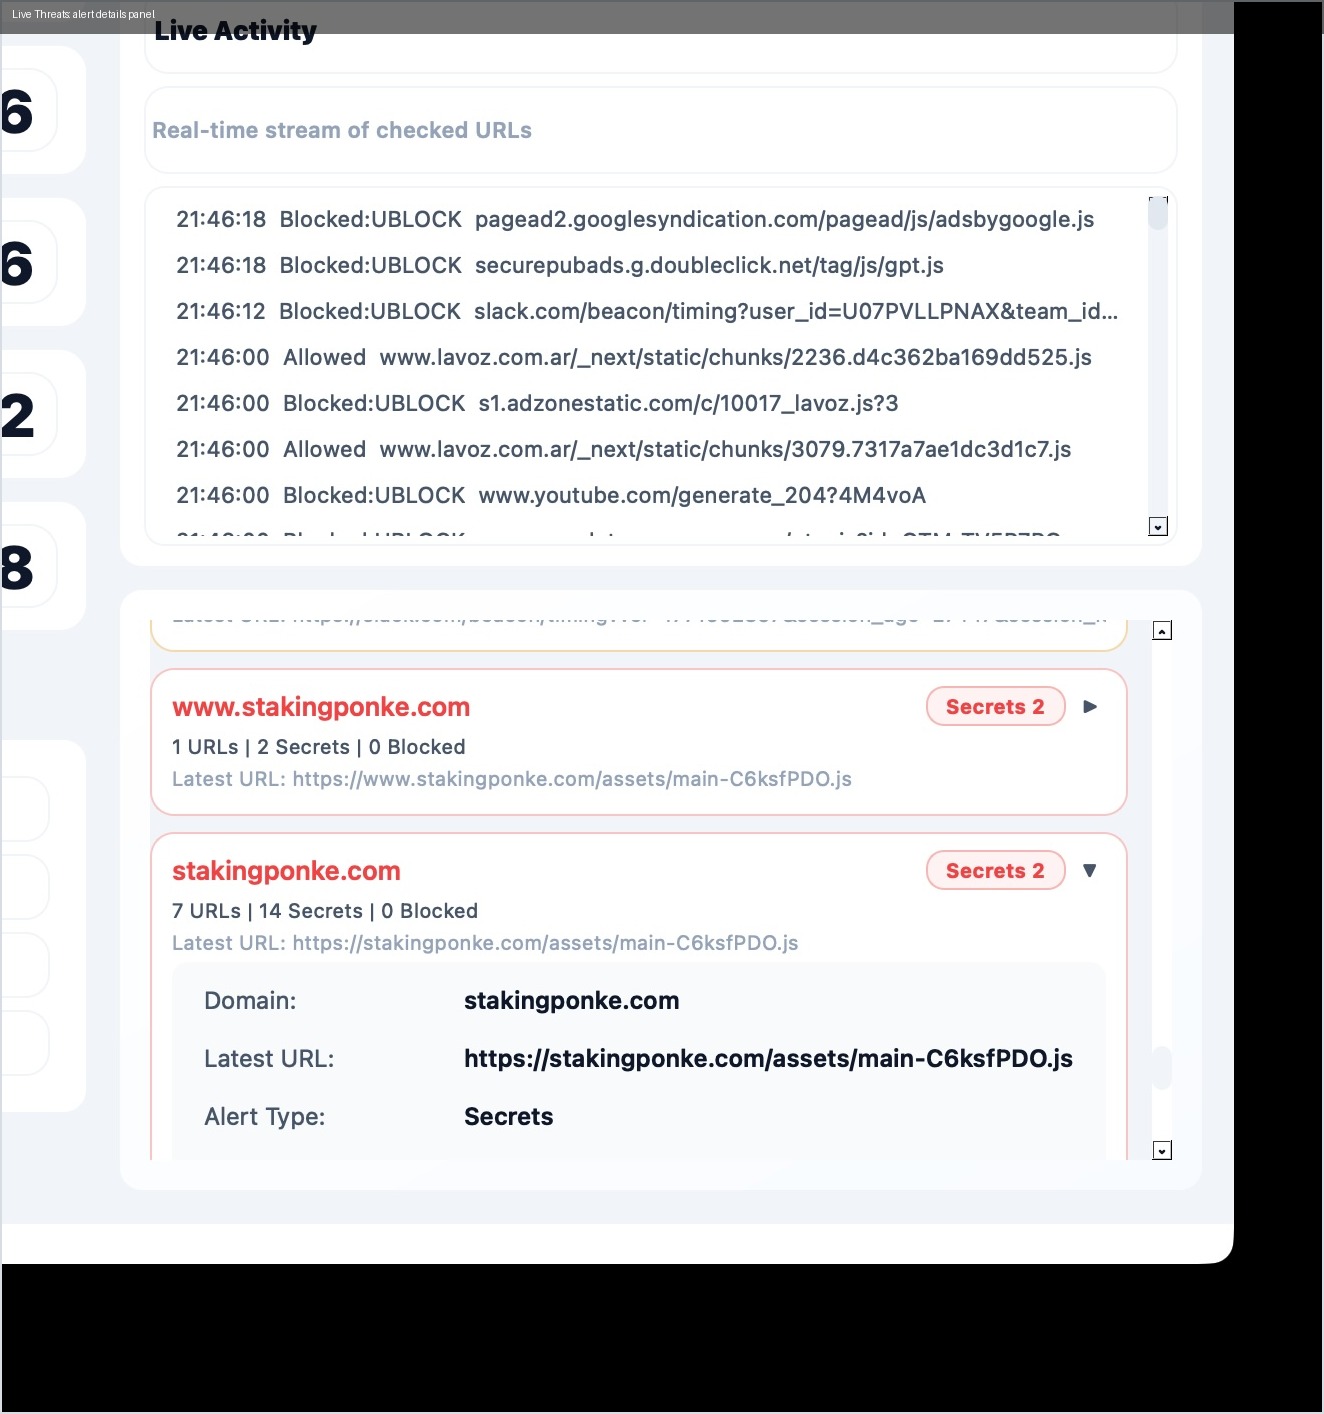
What this page is for:
- Confirm monitoring is active.
- See new events in real time.
- Open details for each event.
- Decide whether to keep blocking or allowlist a domain.
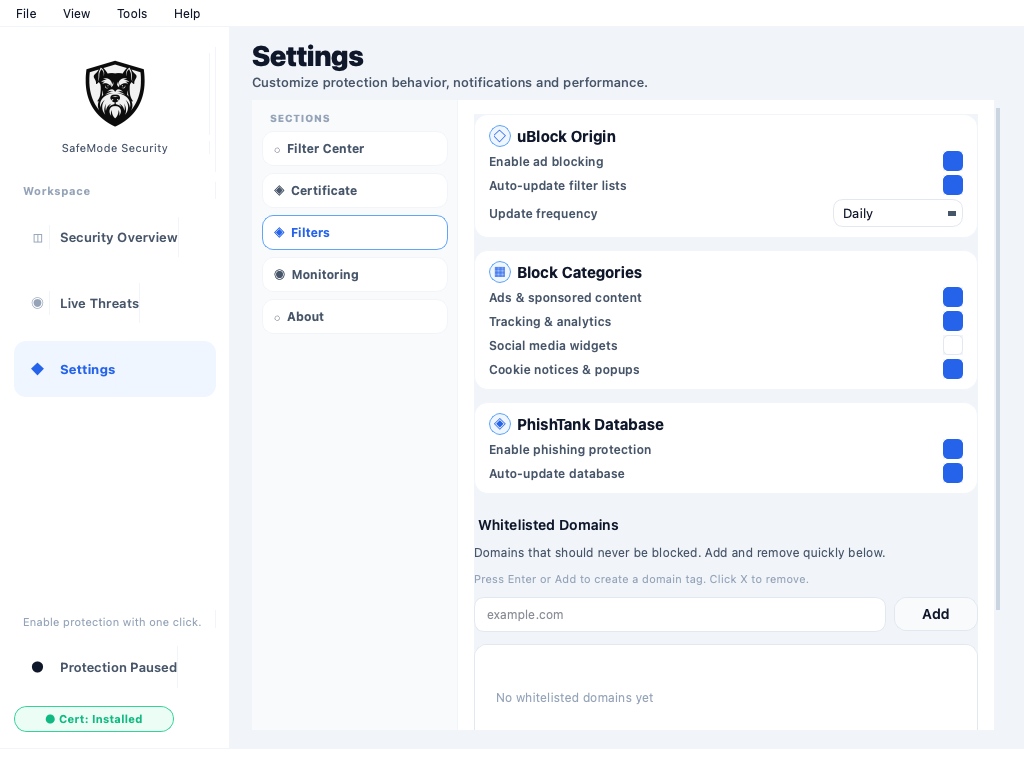
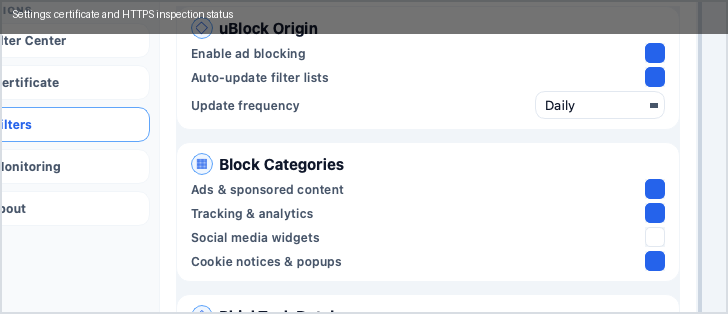
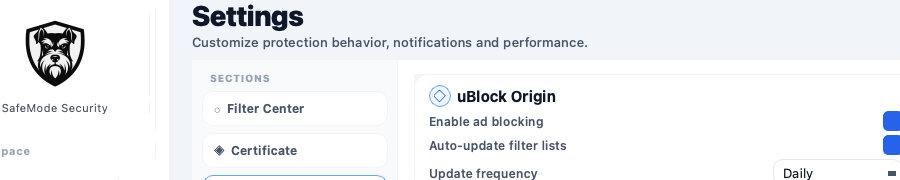
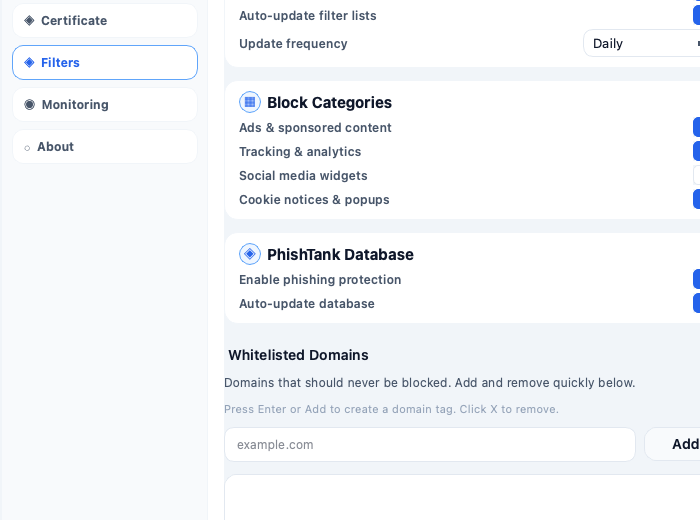
3) Settings
Use Settings for stability and policy, not only one-time setup.
4) Daily Operator Routine
- Open Overview and confirm counters are moving.
- Open Live Threats and review the latest alerts.
- Open Settings and run this checklist:
- verify certificate status,
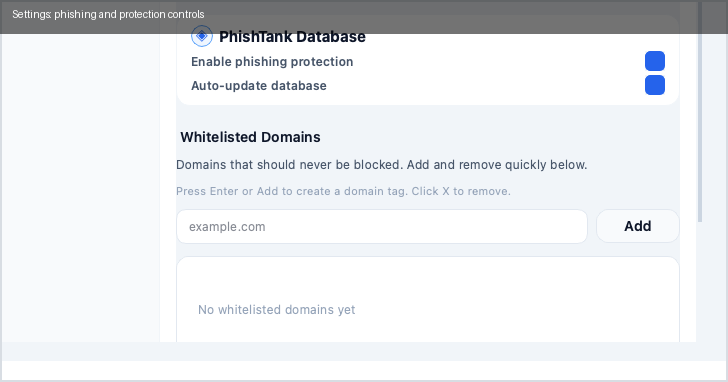
- confirm phishing and security toggles are enabled,
- review filter update status,
- keep the allowlist strict and specific.
- Run update-all filters only when freshness checks require it.